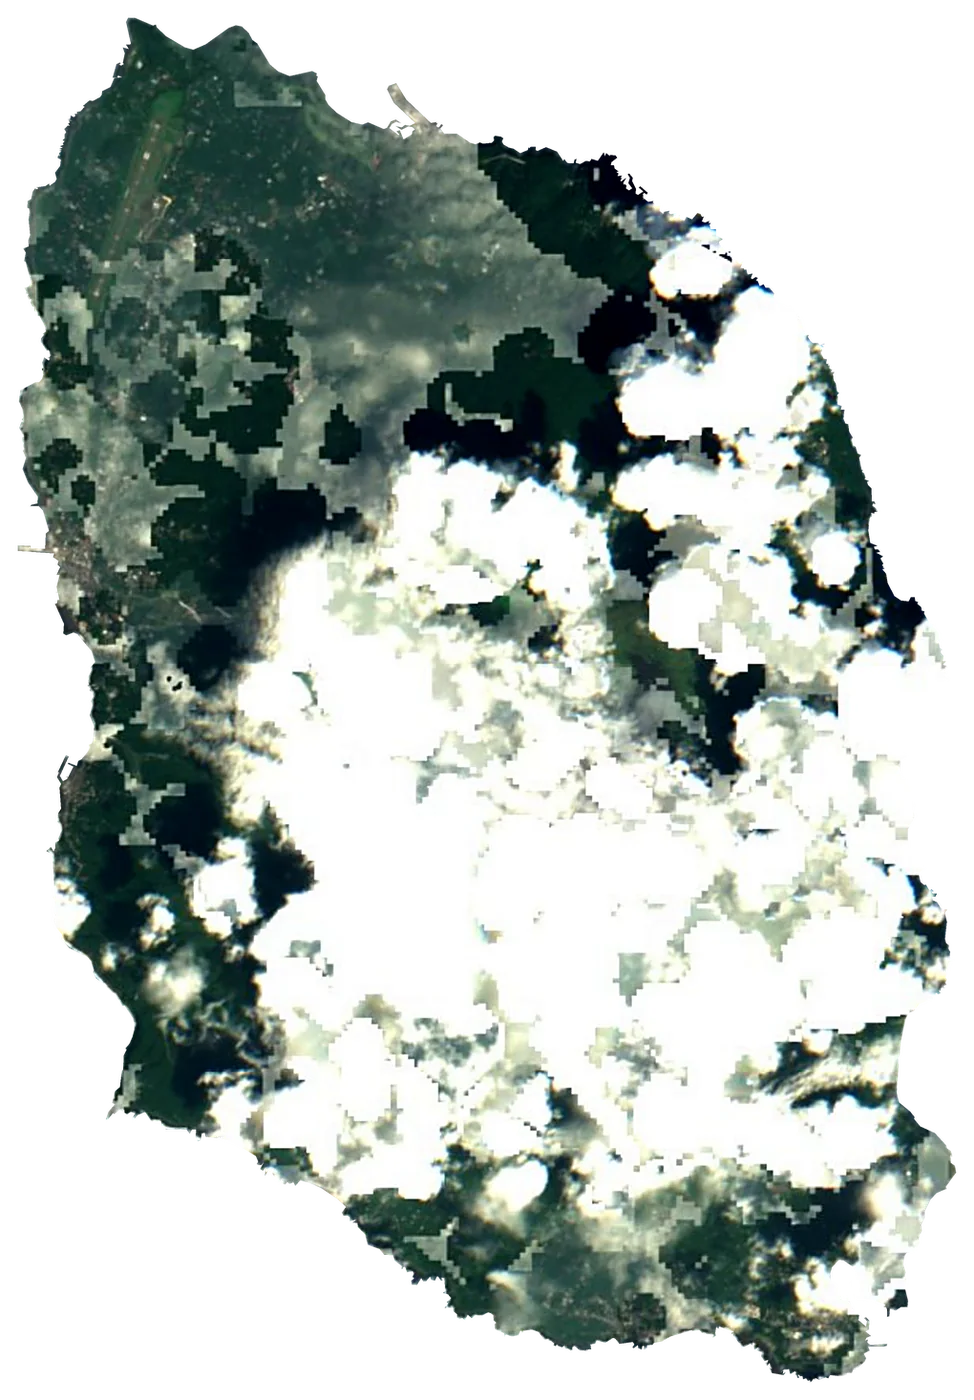
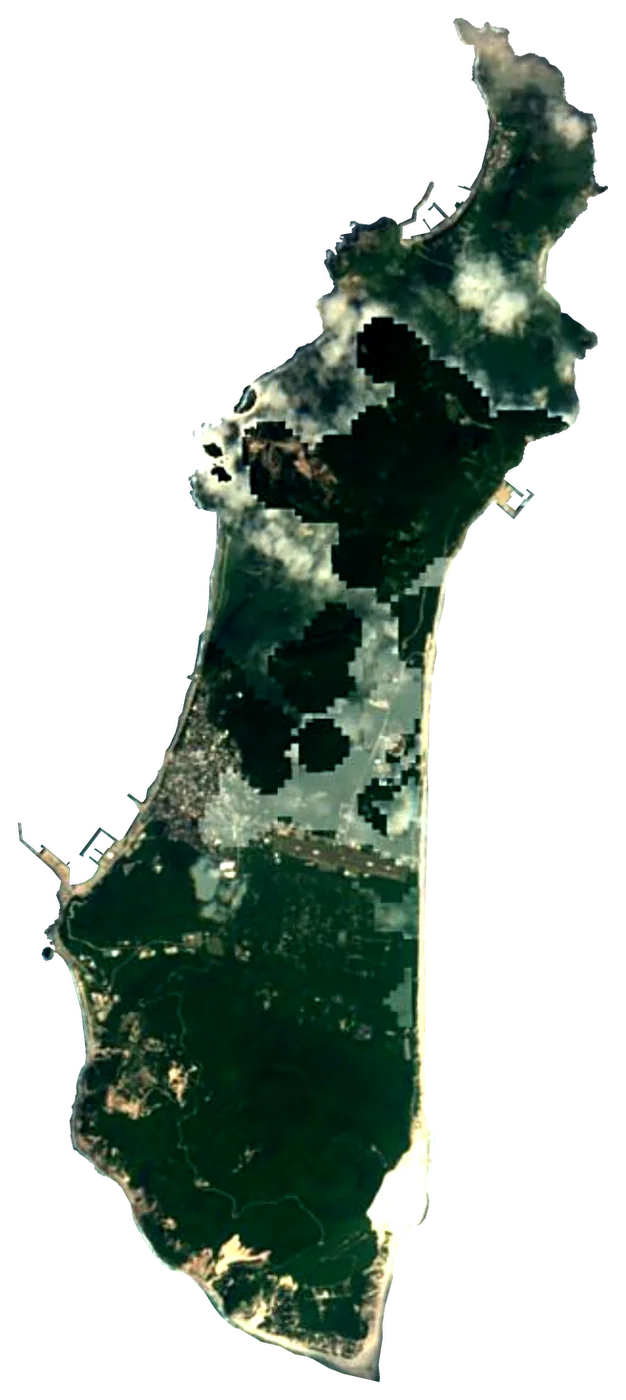
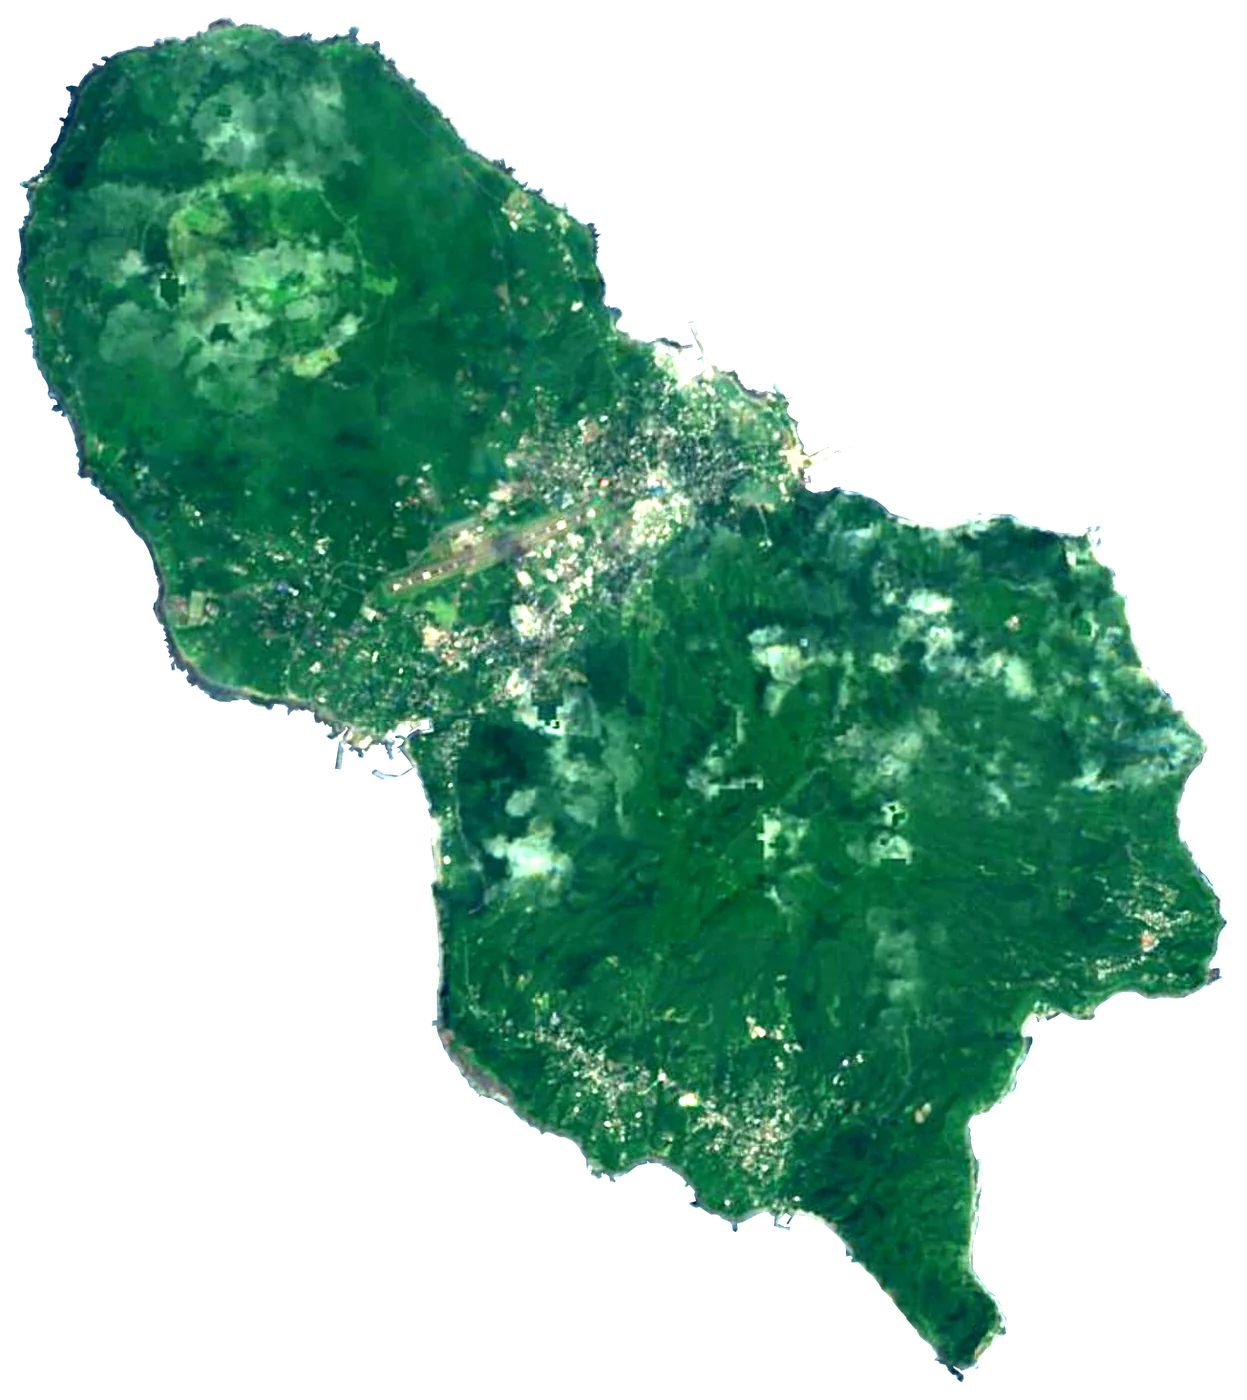
Satellite: Sentinel-2 cloudless 2016 by EOX (CC BY 4.0). Outline and points © OpenStreetMap contributors / Natural Earth. North up.
In numbers
90.8km²
Area
65km
Coastline
764m
Highest point
Mount Mihara
8,514
People
26°C
Warmest sea
August
903km
To the mainland
When to go to Izu Ōshima
Best for the beach from July to October.
The sea is warmest in August (26 °C) and coolest in February (16 °C). Comfortable swimming (21 °C or more): from June to November.
Averages 1991–2020. Sea: NOAA OISST, the water within 35 km of the coast. Air, rain and sun: NASA POWER. Best months weigh warm afternoons (23–30 °C), sea of 24 °C or more and few wet days.
Island in Tokyo, Japan
Izu Ōshima is an volcanic island in Japan. It covers 90.8 km², with 65 km of coastline. Its highest point, Mount Mihara, rises to 764 m. About 8,514 people live on it. The nearest mainland is 903 km away.
Getting there
- Oshima Airport (OIM)airport on the island, with scheduled flightsCar hire at HND airport (Tokyo)Discover Cars · Affiliate link↗
- FerriesTokai Steam Ship Route
- 903 km from the mainlanddistance to the nearest continental coast
- From July to Octoberbest months to go (from 30 years of averages)
Plan the trip
Ferries, stays and things to do
Some links above are affiliate links: if you book through them we may earn a commission, at no extra cost to you. It never changes what the data on this page says.
On the island
What you find on Izu Ōshima.
- 10beachesSanohama beach and 9 more
- 24viewpointsIshi no soribashi (Stone arch), Mt. Mihara peak lookout, West crater lookout and 21 more
- 4lighthouses
- 2ferry terminals
- 9named peaksMt. Miharashinzan, Mt. Kengamine, Mt. Shiroishi and 6 more
- 4volcanoesB1, B2 and 2 more
- 2waterfallsShonin Waterfall
- 1ruins and archaeological sites
- 1dive centres
- 7waymarked walking routesAdventure Trail, Summit Trail, Easy Trail and 4 more
- 2campsitesUmi no furusatomura (Uni no furusato village)
- 34hotels, guesthouses and apartments
- 35restaurants, cafés and bars
Counted in OpenStreetMap, the map anyone can edit, inside the island's outline. A low number may only mean nobody has mapped it yet.
Cross-checked with our atlases
Izu Ōshima in our other atlases
Everything Coastya, Peakyas, Lakeyas and Cascadyas know about what lies inside Izu Ōshima, each with its own numbers.
 1mountainPeakyas
Highest point
764m
Mount Mihara
according to Peakyas
The shape of the land.
On average the island stands 254 m above the sea. 46 % of it is below 200 m.
- 15 %0–50 m
- 31 %50–200 m
- 42 %200–500 m
- 12 %500–1,000 m
Share of the island's area in each altitude band, from the Copernicus DEM (30 m, read at 30–240 m on large islands).
Size, for real
Next to islands you may know.
10 km
All outlines drawn to the same scale (Natural Earth and OpenStreetMap).
Towns on the island
- Ōshima7,102 people
Month by month
The weather on the island.
| Jan | Feb | Mar | Apr | May | Jun | Jul | Aug | Sep | Oct | Nov | Dec | |
|---|---|---|---|---|---|---|---|---|---|---|---|---|
| Afternoon high (°C) | 12 | 13 | 15 | 17 | 20 | 22 | 26 | 27 | 26 | 23 | 19 | 15 |
| Night low (°C) | 10 | 10 | 12 | 15 | 19 | 21 | 25 | 26 | 25 | 21 | 17 | 13 |
| Sea (°C) | 17 | 16 | 16 | 18 | 20 | 22 | 24 | 26 | 26 | 24 | 22 | 19 |
| Rain (mm) | 90 | 104 | 160 | 178 | 199 | 255 | 221 | 161 | 238 | 259 | 136 | 98 |
| Wet days | 7 | 9 | 13 | 13 | 14 | 16 | 16 | 15 | 17 | 15 | 12 | 9 |
| Sun h/day | 4.7 | 4.7 | 5.2 | 5.6 | 5.8 | 4.3 | 5.9 | 7.2 | 5.3 | 4.0 | 4.1 | 4.5 |
| Wind (km/h) | 30 | 28 | 28 | 26 | 22 | 21 | 21 | 19 | 23 | 26 | 26 | 30 |
Averages 1991–2020 for the ~55 km NASA POWER cell over the island; the sea from NOAA OISST.
Recent years
Warmer and cooler years at sea.
Each month's sea temperature compared with its 1991–2020 average, in degrees.
| Jan | Feb | Mar | Apr | May | Jun | Jul | Aug | Sep | Oct | Nov | Dec | |
|---|---|---|---|---|---|---|---|---|---|---|---|---|
| 2020 | +1.8 | +2.0 | +1.1 | +0.6 | +0.1 | +1.2 | +0.1 | +1.3 | +1.6 | +1.1 | +1.3 | +1.9 |
| 2021 | +1.7 | +1.4 | +1.1 | +0.7 | +0.2 | +1.7 | +1.7 | +1.1 | +1.2 | +1.8 | +1.1 | +0.4 |
| 2022 | +0.6 | +1.7 | +1.1 | +0.8 | +1.0 | +0.9 | +1.1 | +0.7 | +1.6 | +1.3 | +1.9 | +1.2 |
| 2023 | +1.5 | +2.1 | +1.8 | +1.7 | +1.0 | +0.8 | +0.9 | +1.5 | +1.7 | +1.4 | +1.4 | +0.2 |
| 2024 | +2.2 | +1.8 | +0.9 | +1.4 | +0.7 | +1.3 | +1.7 | +2.7 | +2.3 | +2.5 | +2.6 | +1.3 |
| 2025 | +1.2 | +0.7 | +0.5 | ±0.0 | −0.2 | +1.9 | +2.4 | +0.1 | +0.6 | +1.0 | −0.4 | +0.9 |
+1 warmer than usual −1 cooler than usual
Photos
Seen by visitors.
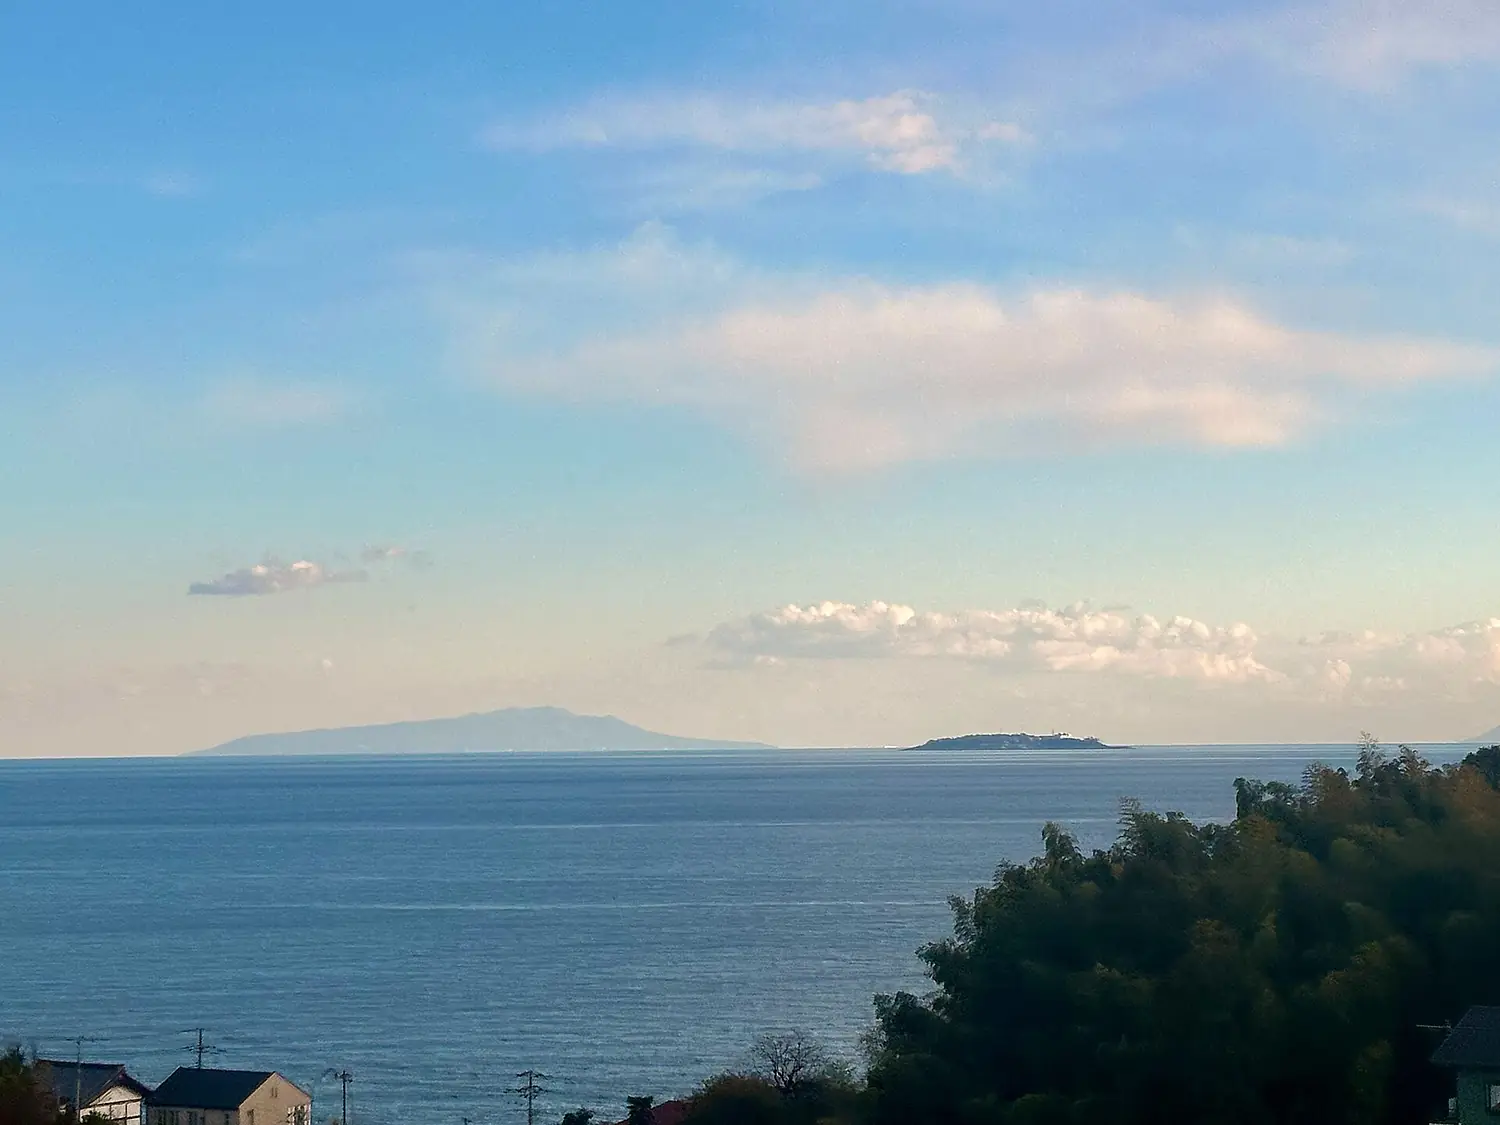
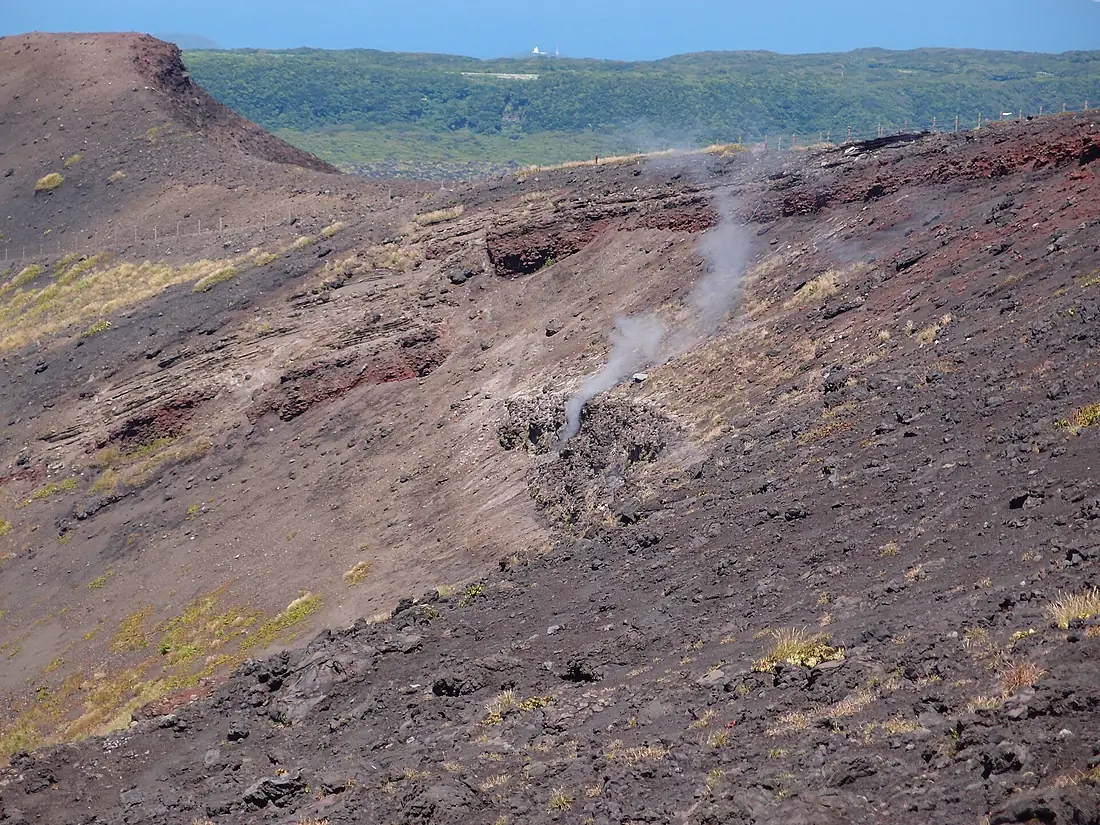
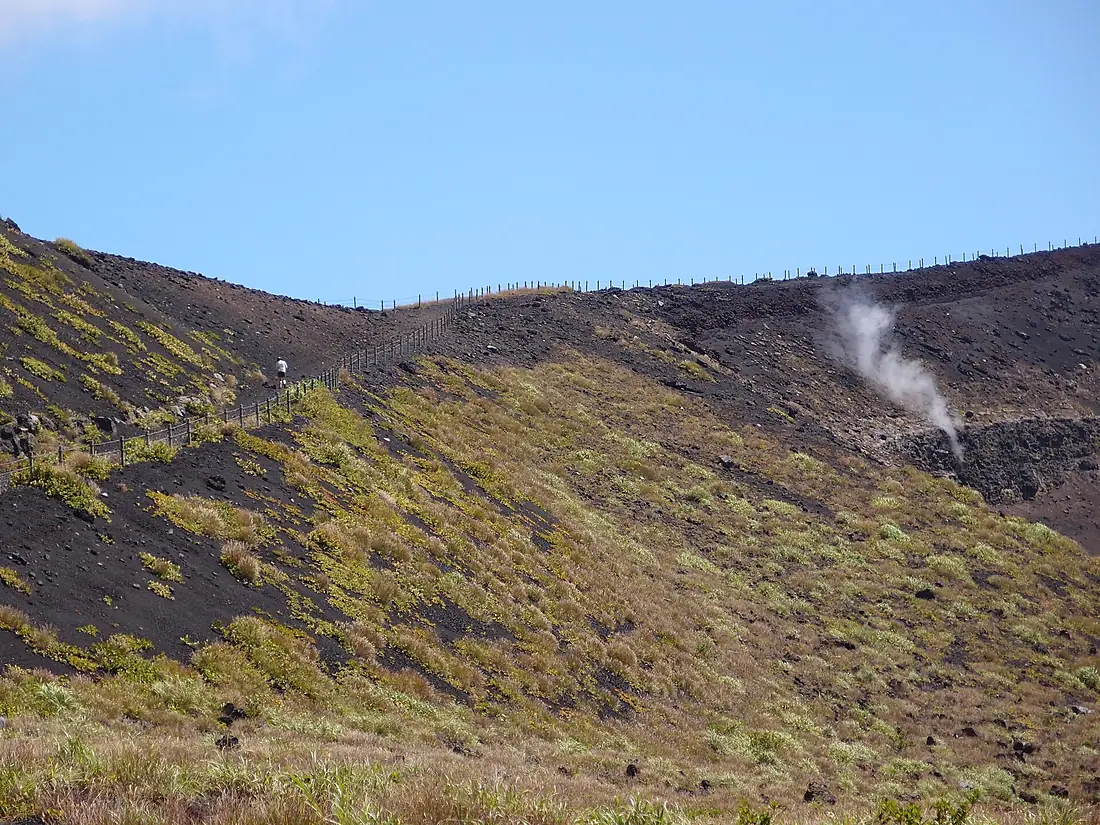
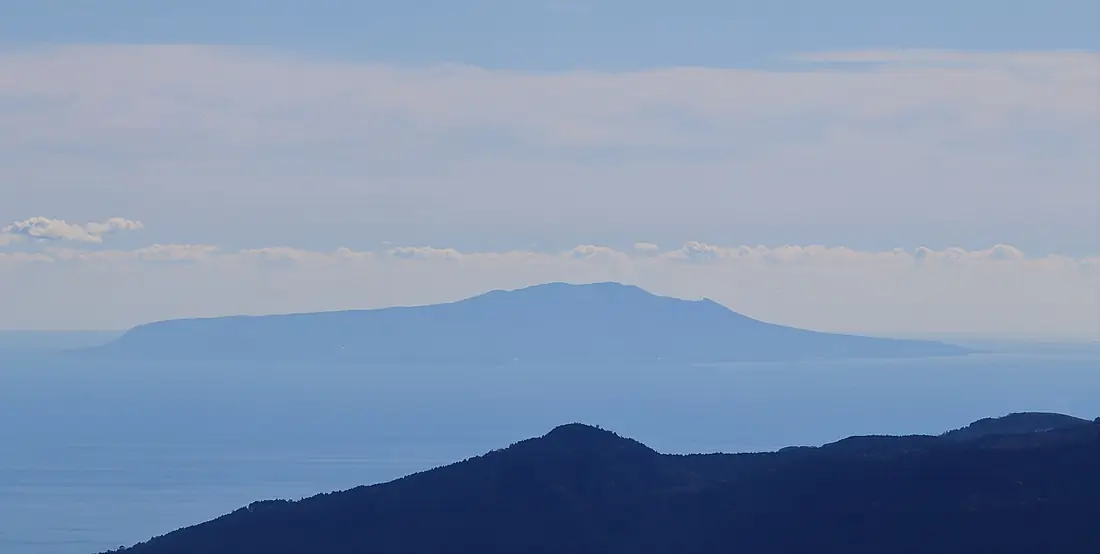
Nearby
More islands nearby.
 Nii-jima
 Japan23 km²432 m42 km away
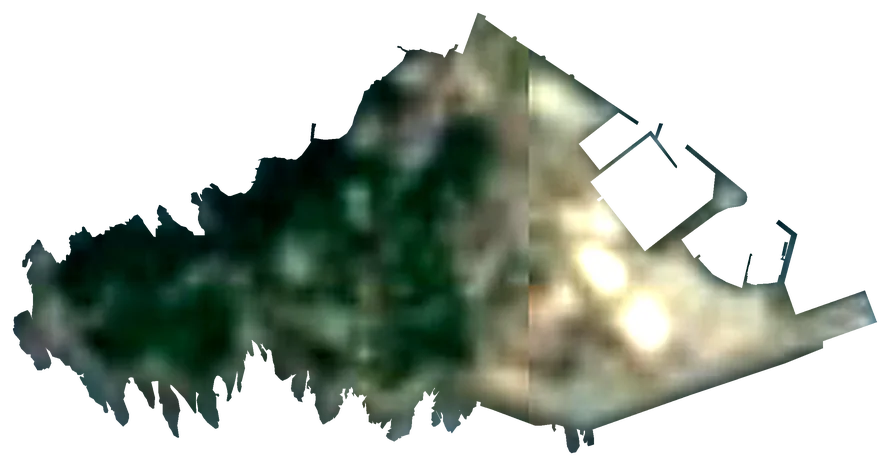 EnoshimaJapan0.39 km²60 m63 km away
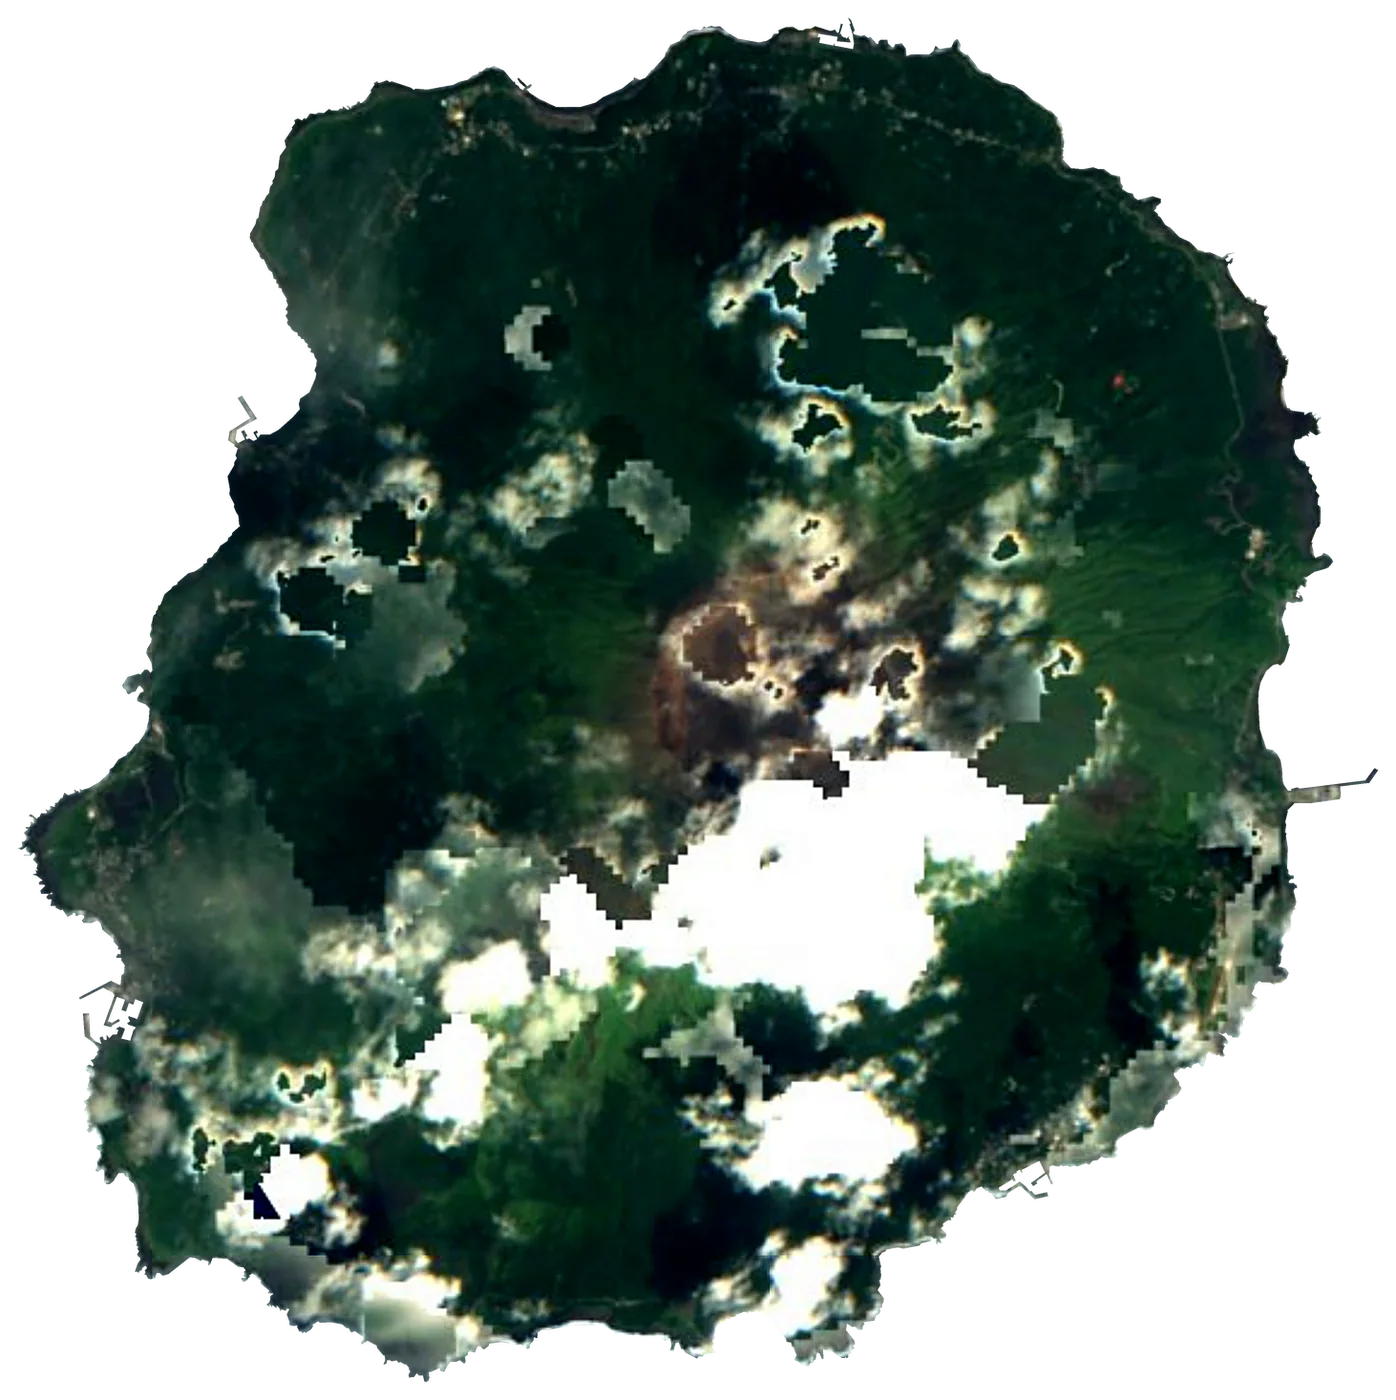 MiyakejimaJapan55 km²815 m75 km away
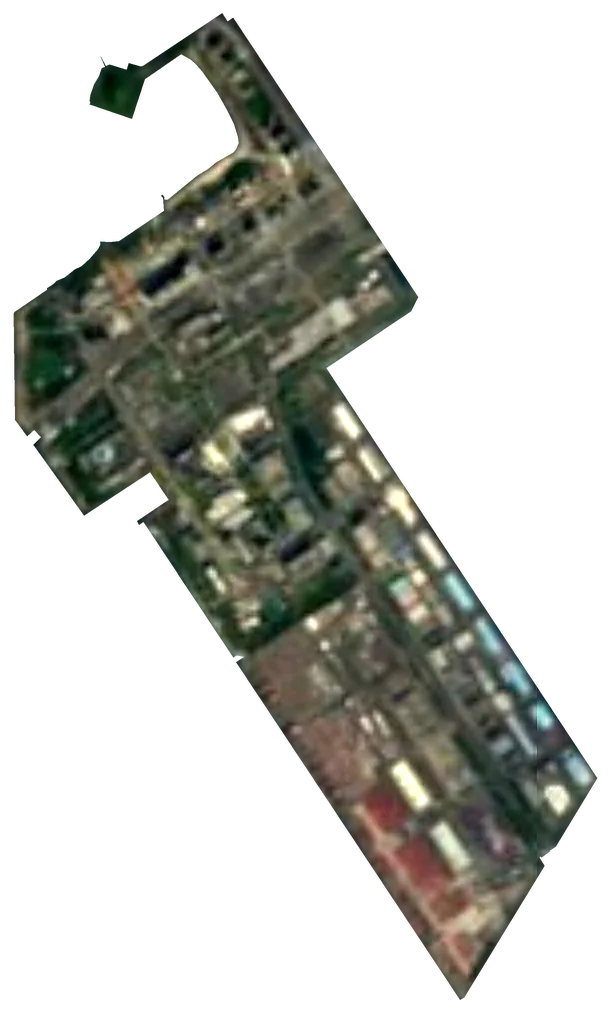 OdaibaJapan3.4 km²21 m105 km away
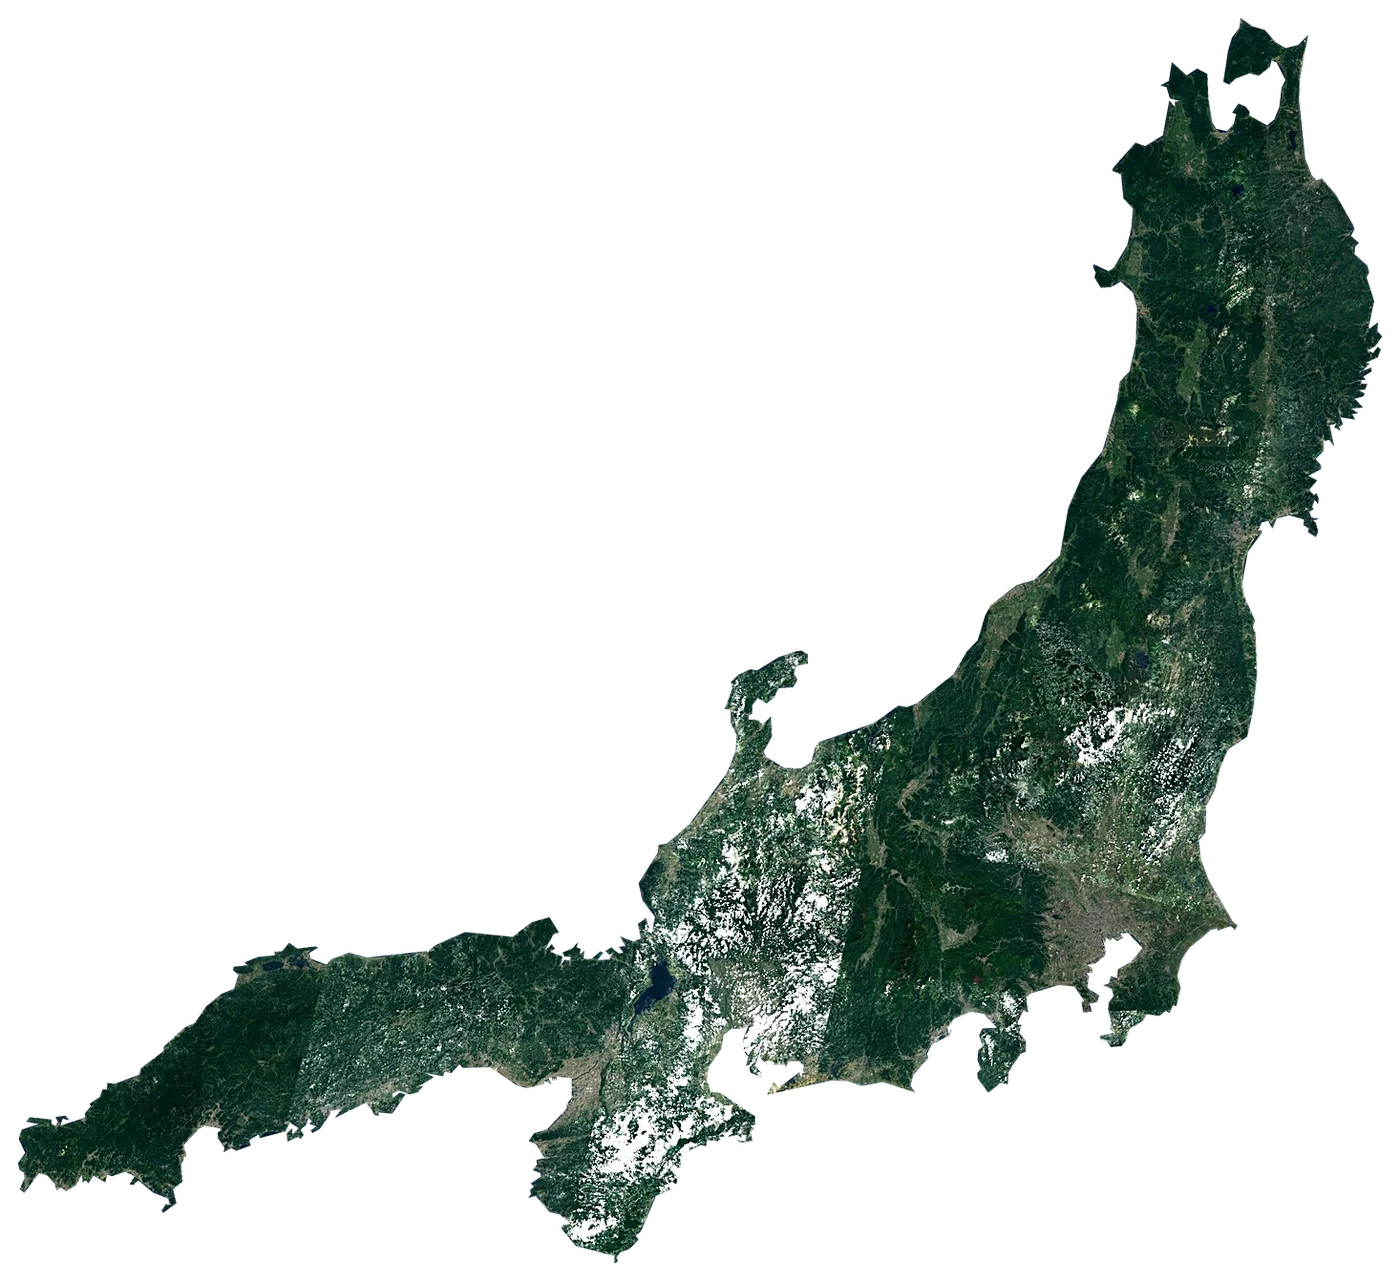 HonshuJapan230,426 km²3,777 m189 km away
 Mikura-jimaJapan21 km²851 m98 km away
 Hachijō-jimaJapan69 km²854 m185 km away
 Chubu Centrair International AirportJapan6.3 km²5 m237 km away
About these numbers
| Names, area, population | Wikidata (Q1070580) · CC0 |
|---|---|
| Outline | © OpenStreetMap contributors · ODbL |
| Sea temperature | NOAA OISST v2.1 · 1991–2020 |
| Climate | NASA POWER · 1991–2020 |
| Relief, 3D model | Copernicus DEM GLO-30 · © DLR e.V., © Airbus Defence and Space GmbH, Copernicus/ESA |
| Beaches, ports, lighthouses, trails | © OpenStreetMap contributors · ODbL |
| Towns | GeoNames · CC BY 4.0 |
| Images | EOX Sentinel-2 cloudless 2016 · CC BY 4.0; Wikimedia Commons |
| Beaches, mountains, lakes and waterfalls | Peakyas — Wikidata · CC0; © OpenStreetMap contributors · ODbL; GeoNames · CC BY 4.0 |
Every figure is an average, an estimate or a count from a public dataset. Licences and methods: data sources.
The family
Do you prefer beaches, lakes, mountains, waterfalls, islands, rivers or canyons?
Same idea, other landscapes: field atlases built on open data, month by month, in seven languages.
 beaches
 Find your beach: sea temperature, sun and swimming month by month.Visit
  lakes
lakes Every lake on Earth: water temperature, ice, depth and the shore.Coming soonVisit mountains
 Every summit in 3D: summit weather, the 0 °C line, huts and trails.Visit
  waterfalls
 Every waterfall: height, flow month by month and when it roars.Coming soonVisit
  islands
 Every island from the sea up: size, sea temperature, ferries and 3D.You are here
 rivers
 Every river from source to sea: the journey, the flow and the basin in numbers.Visit
  canyons
 Every canyon cut to scale: depth to the floor, rim and floor temperatures, trails and viewpoints.Visit