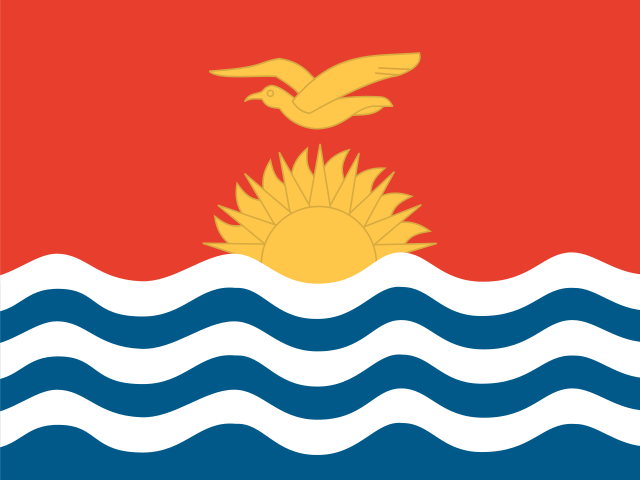
 Kiribati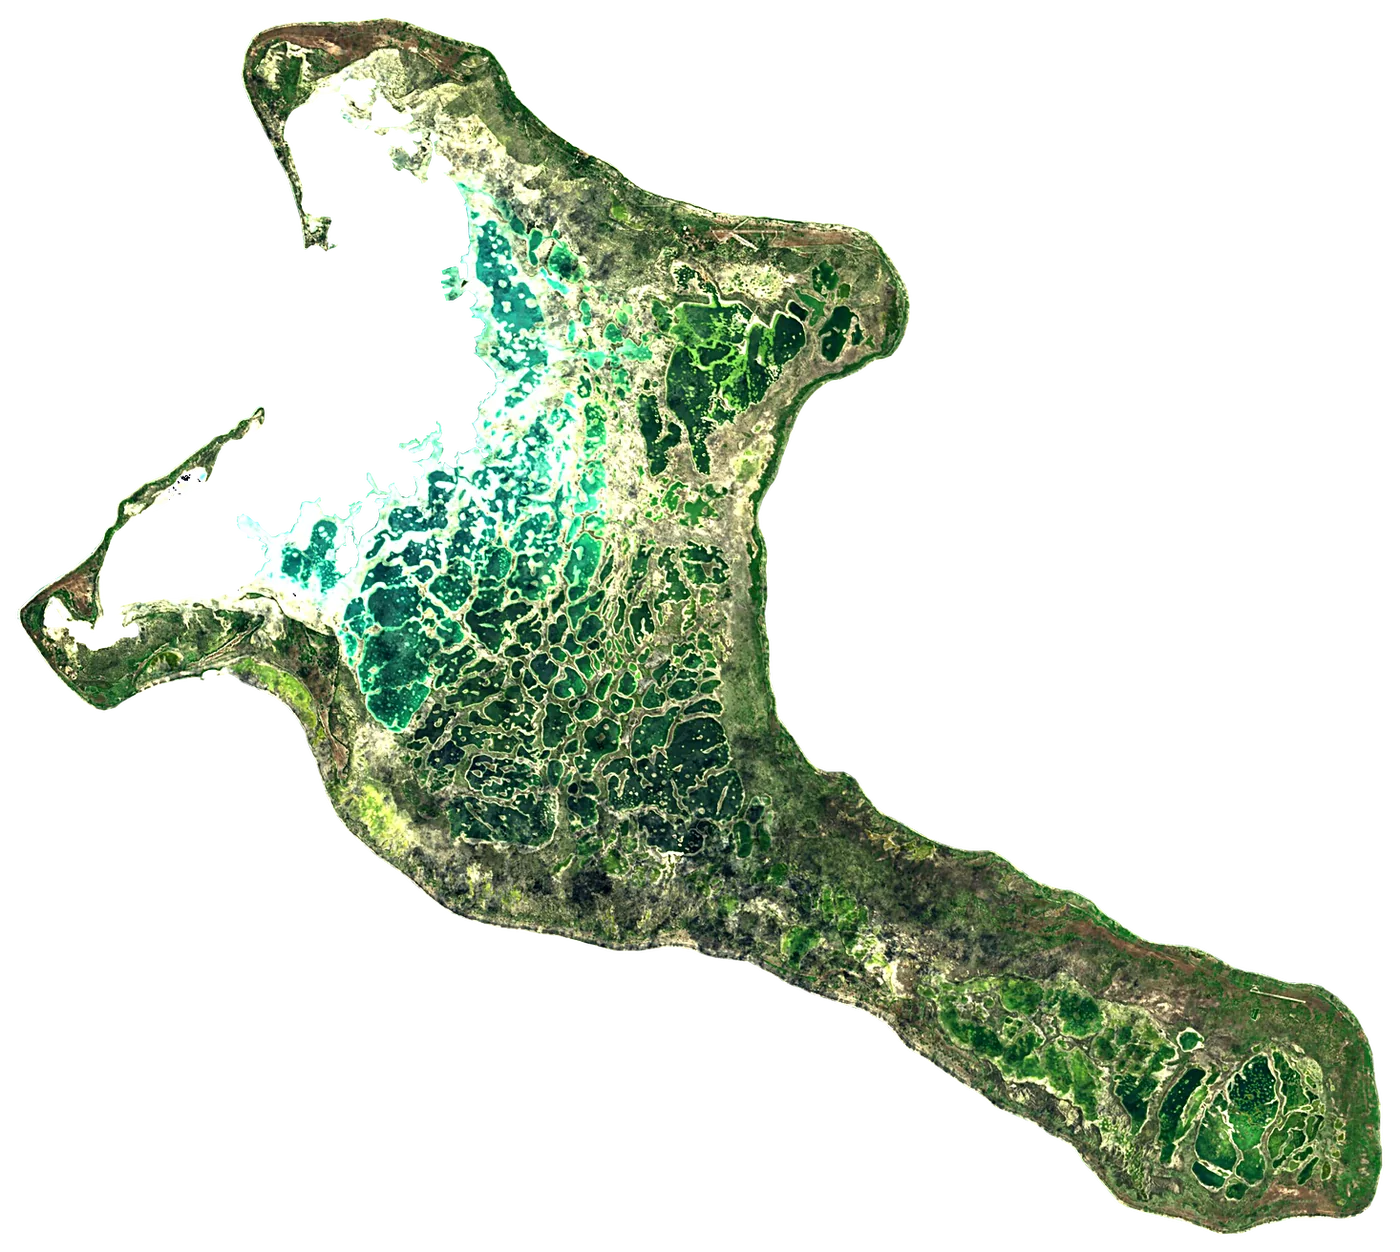
Satellite: Sentinel-2 cloudless 2016 by EOX (CC BY 4.0). Outline and points © OpenStreetMap contributors / Natural Earth. North up.
In numbers
548km²
Area
257km
Coastline
13m
Highest point
Joe's Hill
7,369
People
28°C
Warmest sea
June
5,428km
To the mainland
When to go to Kiritimati
Best for the beach from July to November.
The sea is warmest in June (28 °C) and coolest in January (27 °C). You can swim comfortably all year (21 °C or more).
Averages 1991–2020. Sea: NOAA OISST, the water within 35 km of the coast. Air, rain and sun: NASA POWER. Best months weigh warm afternoons (23–30 °C), sea of 24 °C or more and few wet days.
Coral atoll in the northern Line Islands, Kiribati
Kiritimati is an atoll in Kiribati. It belongs to Line Islands. It covers 548 km², with 257 km of coastline. Its highest point, Joe's Hill, rises to 13 m. About 7,369 people live on it. The nearest mainland is 5,428 km away.
Getting there
- Cassidy International Airport (CXI)airport on the island, with scheduled flights
- 5,428 km from the mainlanddistance to the nearest continental coast
- From July to Novemberbest months to go (from 30 years of averages)
Plan the trip
Ferries, stays and things to do
Some links above are affiliate links: if you book through them we may earn a commission, at no extra cost to you. It never changes what the data on this page says.
On the island
What you find on Kiritimati.
- 10beaches
- 1named peaksJoe’s Hill
- 3ruins and archaeological sitesForward Zone
- 2campsites
- 2hotels, guesthouses and apartments
Counted in OpenStreetMap, the map anyone can edit, inside the island's outline. A low number may only mean nobody has mapped it yet.
The shape of the land.
On average the island stands 2 m above the sea. 100 % of it is below 200 m.
- 100 %0–50 m
Share of the island's area in each altitude band, from the Copernicus DEM (30 m, read at 30–240 m on large islands).
Size, for real
Next to islands you may know.
50 km
All outlines drawn to the same scale (Natural Earth and OpenStreetMap).
Towns on the island
- Tabwakea Village1,881 people
- London Village1,829 people
- Banana1,209 people
- Banana Village1,170 people
Month by month
The weather on the island.
| Jan | Feb | Mar | Apr | May | Jun | Jul | Aug | Sep | Oct | Nov | Dec | |
|---|---|---|---|---|---|---|---|---|---|---|---|---|
| Afternoon high (°C) | 27 | 27 | 28 | 28 | 28 | 28 | 28 | 28 | 28 | 28 | 28 | 27 |
| Night low (°C) | 26 | 26 | 26 | 27 | 27 | 27 | 27 | 27 | 27 | 27 | 26 | 26 |
| Sea (°C) | 27 | 27 | 27 | 28 | 28 | 28 | 28 | 28 | 28 | 28 | 28 | 27 |
| Rain (mm) | 64 | 88 | 100 | 109 | 73 | 70 | 40 | 28 | 29 | 30 | 35 | 71 |
| Wet days | 8 | 11 | 17 | 20 | 16 | 13 | 8 | 5 | 4 | 6 | 5 | 9 |
| Sun h/day | 8.5 | 8.5 | 8.2 | 7.9 | 8.4 | 8.8 | 9.2 | 9.7 | 9.8 | 9.6 | 9.3 | 8.8 |
| Wind (km/h) | 24 | 23 | 22 | 21 | 19 | 20 | 22 | 22 | 22 | 20 | 22 | 24 |
Averages 1991–2020 for the ~55 km NASA POWER cell over the island; the sea from NOAA OISST.
Recent years
Warmer and cooler years at sea.
Each month's sea temperature compared with its 1991–2020 average, in degrees.
| Jan | Feb | Mar | Apr | May | Jun | Jul | Aug | Sep | Oct | Nov | Dec | |
|---|---|---|---|---|---|---|---|---|---|---|---|---|
| 2020 | +0.7 | +0.6 | +0.8 | +0.4 | −0.2 | +0.3 | +0.2 | −0.8 | −0.7 | −1.3 | −0.7 | −1.4 |
| 2021 | −1.7 | −1.4 | −0.9 | −0.6 | −0.2 | +0.1 | −0.3 | −0.1 | −0.1 | −0.8 | −0.5 | −1.1 |
| 2022 | −1.0 | −0.3 | −1.0 | −1.0 | −1.2 | −0.8 | −0.8 | −1.1 | −1.1 | −0.9 | −1.0 | −0.9 |
| 2023 | −1.0 | −0.7 | ±0.0 | +0.3 | +0.3 | +0.8 | +1.0 | +1.4 | +1.2 | +1.3 | +1.8 | +2.0 |
| 2024 | +1.7 | +1.5 | +1.0 | +0.7 | +0.2 | +0.3 | +0.2 | +0.6 | −0.5 | −0.8 | ±0.0 | −0.7 |
| 2025 | −0.7 | −0.4 | −0.6 | −0.4 | −0.4 | ±0.0 | −0.2 | −0.2 | −0.3 | −0.7 | −1.0 | −0.1 |
+1 warmer than usual −1 cooler than usual
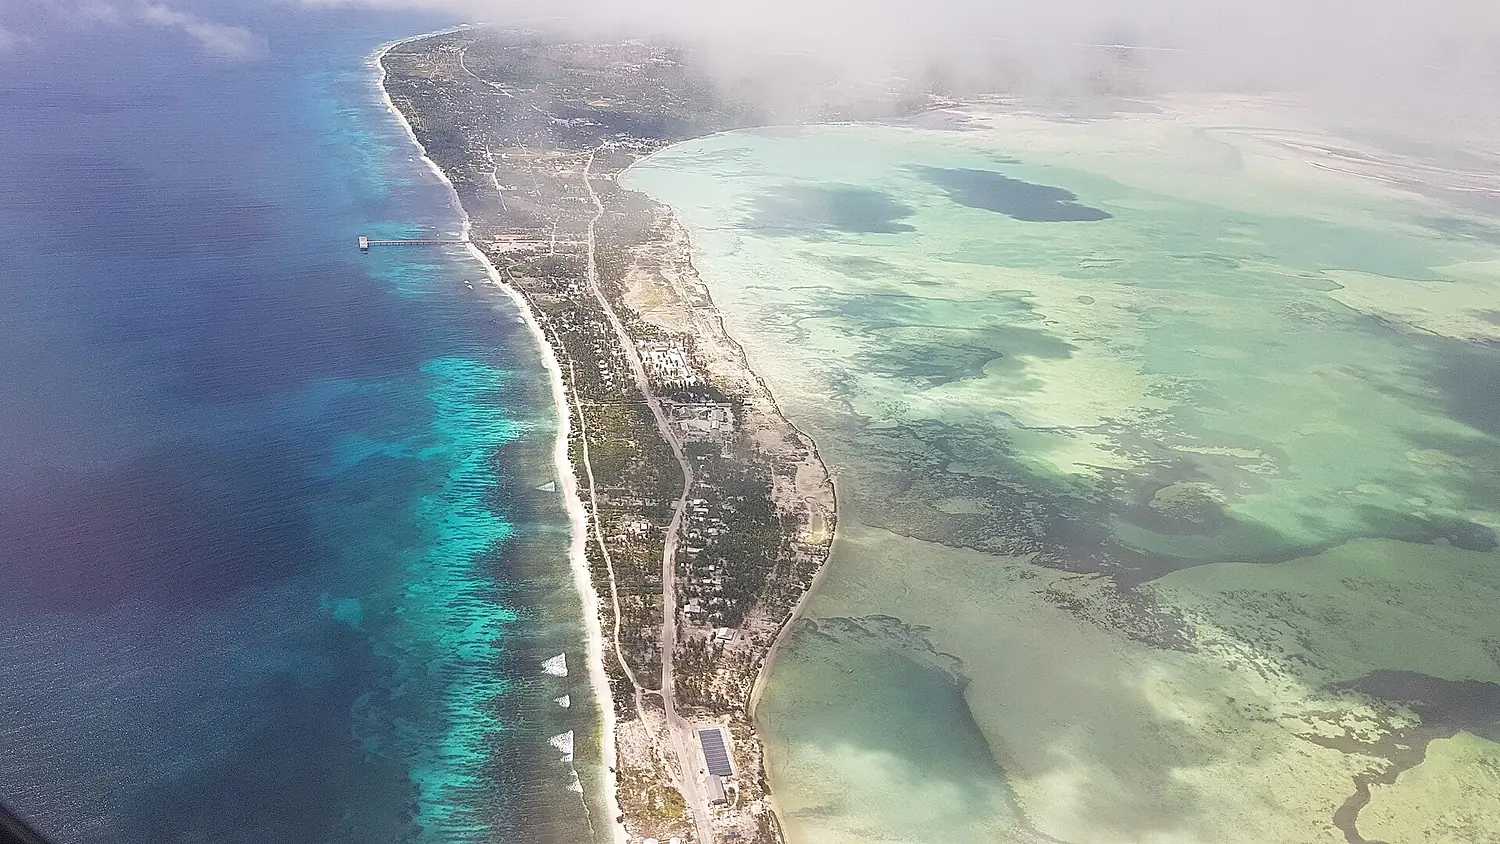
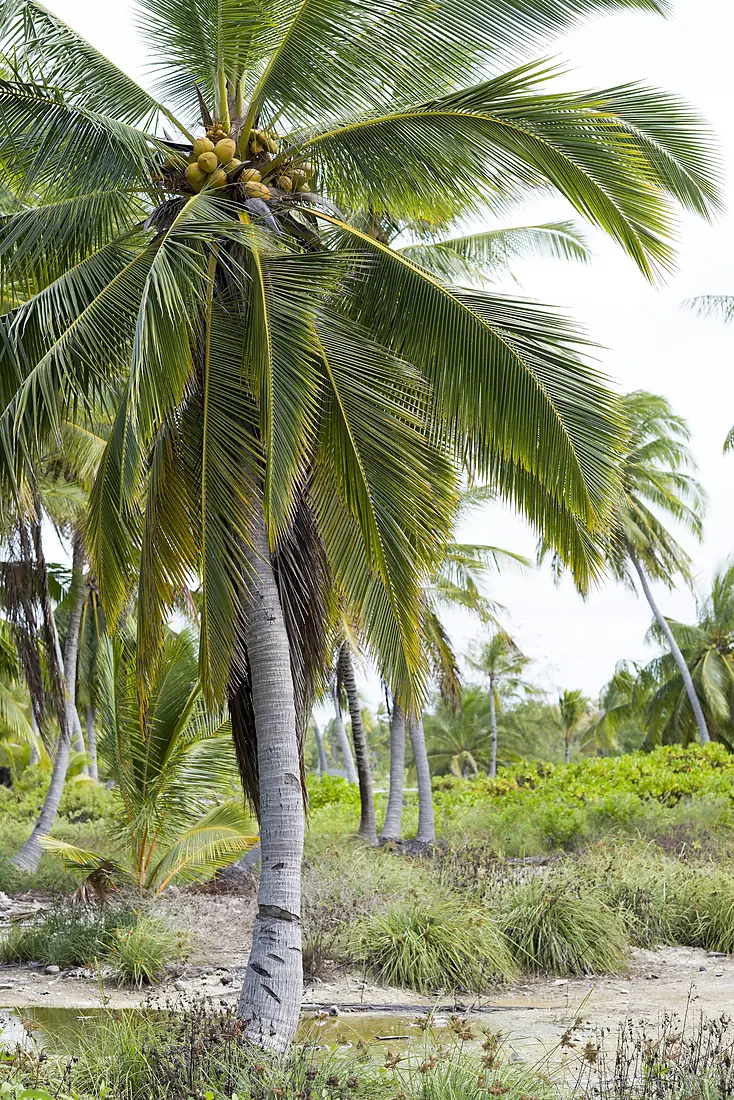
Photos
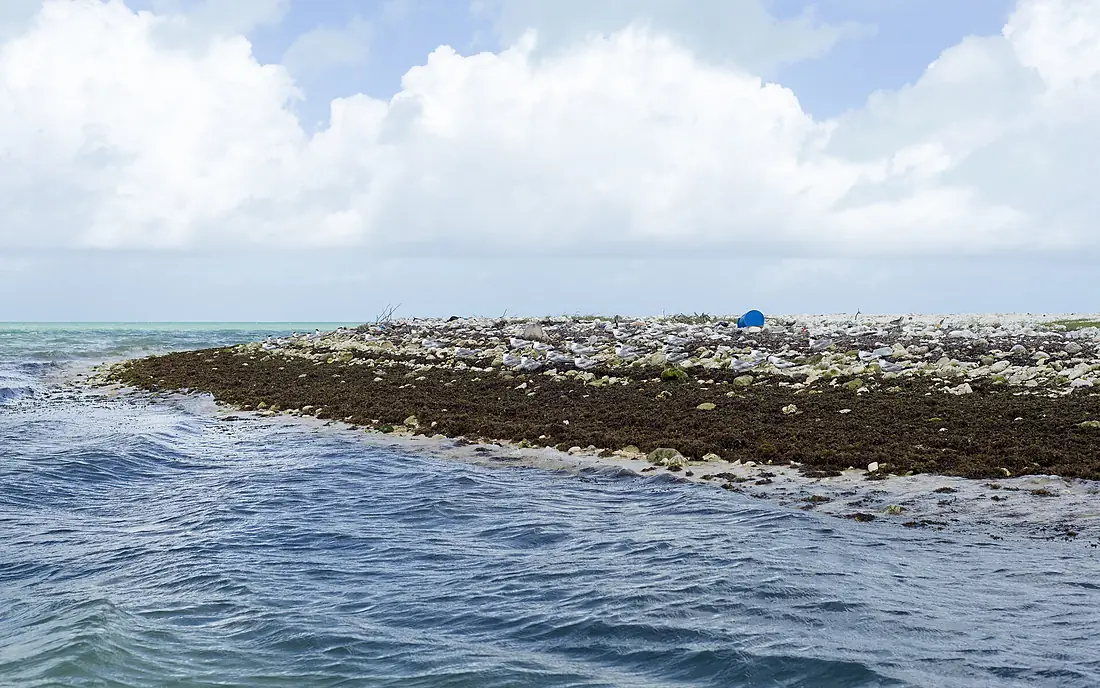
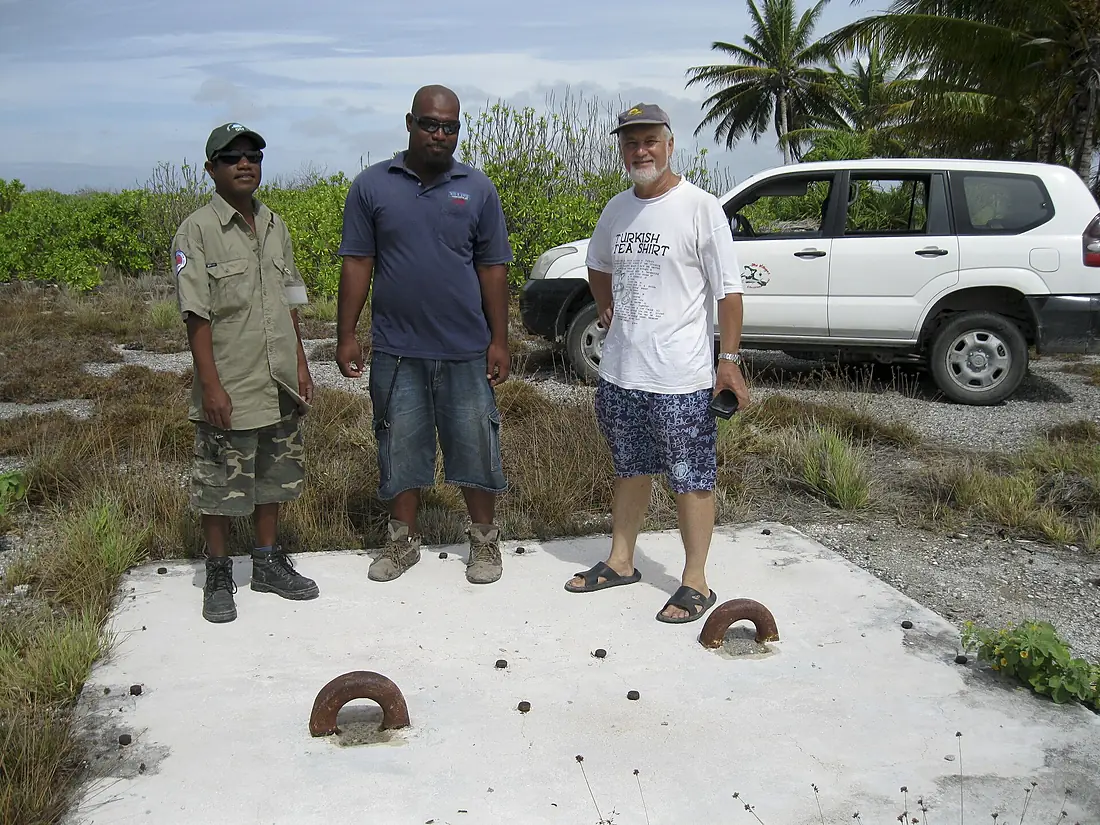
Seen by visitors.
Nearby
More islands nearby.

 United States
About these numbers
| Names, area, population | Wikidata (Q193331) · CC0 |
|---|---|
| Outline | © OpenStreetMap contributors · ODbL |
| Sea temperature | NOAA OISST v2.1 · 1991–2020 |
| Climate | NASA POWER · 1991–2020 |
| Relief, 3D model | Copernicus DEM GLO-30 · © DLR e.V., © Airbus Defence and Space GmbH, Copernicus/ESA |
| Beaches, ports, lighthouses, trails | © OpenStreetMap contributors · ODbL |
| Towns | GeoNames · CC BY 4.0 |
| Images | EOX Sentinel-2 cloudless 2016 · CC BY 4.0; Wikimedia Commons |
Every figure is an average, an estimate or a count from a public dataset. Licences and methods: data sources.
The family
Do you prefer beaches, lakes, mountains, waterfalls, islands, rivers or canyons?
Same idea, other landscapes: field atlases built on open data, month by month, in seven languages.
 beaches
 Find your beach: sea temperature, sun and swimming month by month.Visit
  lakes
lakes Every lake on Earth: water temperature, ice, depth and the shore.Coming soonVisit
  mountains
 Every summit in 3D: summit weather, the 0 °C line, huts and trails.Visit
  waterfalls
 Every waterfall: height, flow month by month and when it roars.Coming soonVisit
  islands
 Every island from the sea up: size, sea temperature, ferries and 3D.You are here
 rivers
 Every river from source to sea: the journey, the flow and the basin in numbers.Visit
  canyons
 Every canyon cut to scale: depth to the floor, rim and floor temperatures, trails and viewpoints.Coming soonVisit